
Sudoku Solver AR Part 9: Canny Part 4 (Connectivity Analysis)
This post is part of a series where I explain how to build an augmented reality Sudoku solver. All of the image processing and computer vision is done from scratch. See the first post for a complete list of topics.
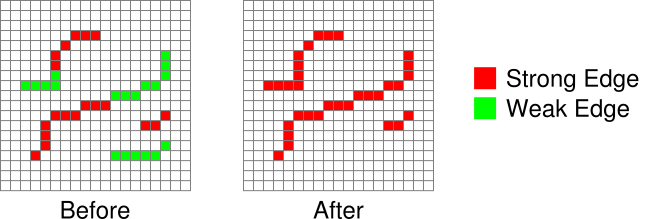
It’s finally time to finish implementing the Canny edge detector algorithm. The previous step produced an image where strong and weak edges were detected. Pixels marked as strong edges are assumed to be actual edges. On the other hand, pixels marked as weak edges are considered to only “maybe” be edges. So the question remains, when should a weak edge actually be a strong edge? If you have a chain of strong edges connected to each other, then there is definitely an edge running along them. You could then reason that if a group of weak edges are directly connected to these strong edges, they are part of the same edge and should be promoted. This is where connectivity analysis comes in.
Connectivity analysis is a very mathy term but is straight forward with respect to image processing. The whole idea is about examining groups of pixels that meet some requirement and are connected in such a way that you can move from any one pixel in the group to any other without leaving the group. Say you have a pixel that meets a certain criteria. Look at each of the surrounding pixels and check if it meets a criteria (could be the same as before but doesn’t have to be). If it does, the pixels are connected. Repeat this process to find all pixels in the group. That’s it, actually really simple, right?
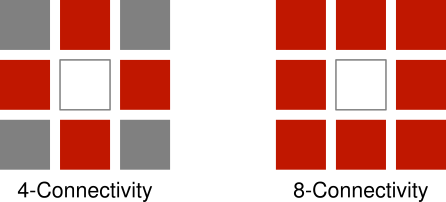
Which surrounding pixels should be examined depends on application. The two most common patterns are known as 4- and 8-connectivity. The former checks the pixels directly left, right, above, and below. The latter checks all of the same pixels as 4-connectivity but also top-left, top-right, bottom-left, and bottom-right.
In this case, we need to find strong edge pixels and then check each surrounding pixel if it’s a weak edge pixel. If it is, change it into a strong edge pixel since the strong and weak edges are connected.
You might be wondering if you can search in the reverse order. Find weak edges and check for surrounding strong edges. The answer is yes, but it’ll probably be slower because the hysteresis thresholding used to determine if an edge is strong or weak guarantees that there are at least as many weak edges as strong edges.
Code
The implementation below searches for all strong edges. Whenever a strong edge is found, a flood fill is used to examine all 8 surrounding pixels for weak edges. Found weak edges are promoted to strong edges. The flood fill repeatedly searches the 8 surrounding pixels surrounding each promoted edge until no more weak edges are found.
Image image; //Input: Should be output of Non-Maximum Suppression.
             //       Channel 0: Strong edge pixels.
             //       Channel 1: Weak edge pixels.
             //       Channel 2: Should be set to 0.
             //       There should be no strong edge pixels in the pixels touching the
             //       border of the image.
             //Output: Image will have all weak edges connected to strong edges changed
             //        into strong edges. Only the first channel will have useful data,
             //        the other channels should be ignored.

//Keep track of coordinates that should be searched in case they are connected.
std::stack<std::pair<unsigned int,unsigned int>> searchStack;

//Add all 8 coordinates around (x,y) to be searched.
auto PushSearchConnected = [&searchStack](const unsigned int x,const unsigned int y) {
    searchStack.push(std::make_pair(x - 1,y - 1));
    searchStack.push(std::make_pair(x    ,y - 1));
    searchStack.push(std::make_pair(x + 1,y - 1));
    searchStack.push(std::make_pair(x - 1,y));
    searchStack.push(std::make_pair(x    ,y));
    searchStack.push(std::make_pair(x + 1,y));
    searchStack.push(std::make_pair(x - 1,y + 1));
    searchStack.push(std::make_pair(x    ,y + 1));
    searchStack.push(std::make_pair(x + 1,y + 1));
};

//Find strong edge pixels and flood fill so all connected weak edges are turned into
//strong edges.
for(unsigned int y = 1;y < image.height - 1;y++)
{
    for(unsigned int x = 1;x < image.width - 1;x++)
    {
        const unsigned int index = (y * image.width + x) * 3;

        //Skip pixels that are not strong edges.
        if(image.data[index + 0] == 0)
            continue;

        //Flood fill all connected weak edges.
        PushSearchConnected(x,y);
        while(!searchStack.empty())
        {
            const std::pair<unsigned int,unsigned int> coordinates = searchStack.top();
            searchStack.pop();

            //Skip pixels that are not weak edges.
            const unsigned int x = coordinates.first;
            const unsigned int y = coordinates.second;
            const unsigned int index = (y * image.width + x) * 3;
            if(image.data[index + 1] == 0)
                continue;

            //Promote to strong edge.
            image.data[index + 0] = 255;
            image.data[index + 1] = 0;

            //Search around this coordinate as well. This will waste time checking the previous
            //coordinate again but it's fast enough.
            PushSearchConnected(x,y);
        }
    }
}
Putting it All Together
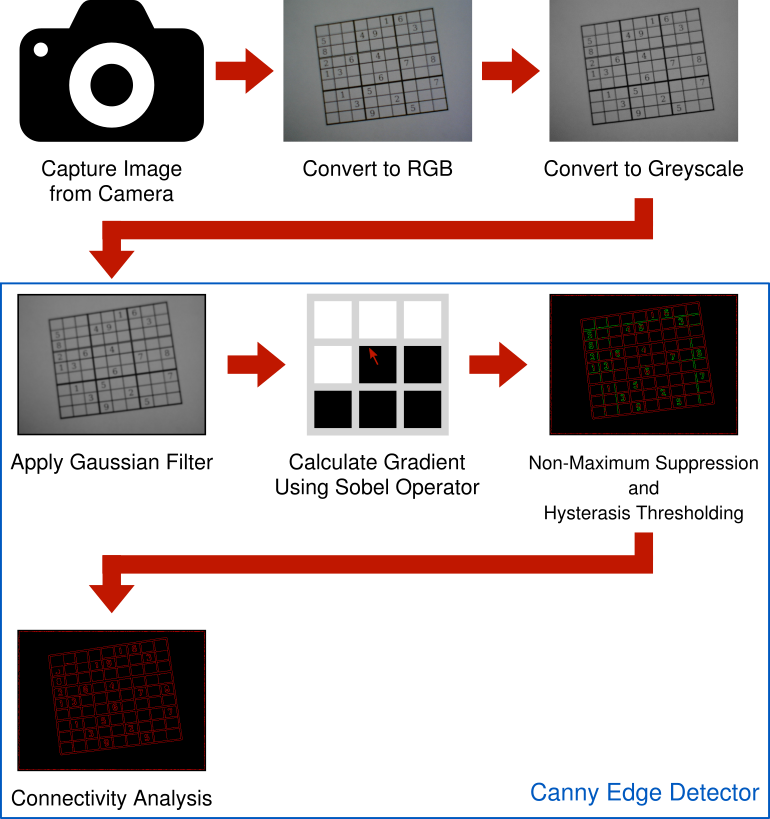
Here’s the pipeline so far. An RGB image is captured using a camera. The RGB image is converted to greyscale so it can be processed with the Canny edge detector. The Canny edge detector, applies a Gaussian filter to remove noise and suppress insignificant edges. The “flow” of the image is analyzed by finding gradients using the Sobel operator. These gradients are the measured strength and direction of change in pixel intensities. Non-Maximum Suppression is applied using the gradients to find potential edges. Hysteresis Thresholding compares the potential edge gradients strengths to a couple of thresholds which categorize if an edge is an actual edge, maybe an edge, or not an edge. Finally, Connectivity Analysis promotes those “maybe” edges to actual edges whenever they’re directly connected to an actual edge.
Besides the input image, the Canny edge detector has three tweakable parameters that can have a big impact on whether an edge is detected or not. The first is the radius of the Gaussian filter. If the radius is too large, edges are blended together and not detected. If the radius is too small, small edges or noise are detected which should be ignored. An effective radius choice is further complicated by the results depending on the size of image being used. For this project, images are 640x480 and I’ve found a radius of 5 pixels works quite well. Larger images can be downscaled which, depending on choice of sampling filter, helps to further suppress noise anyway. Smaller images are not practical because they lack a sufficient number of pixels for all of the numbered digits to be identified reliably.
The other two parameters are the high and low thresholds used in the Hysteresis Thresholding step. These are a little trickier to get right and are problem dependent. In general, having the high threshold two or three times the low threshold works well. But that still leaves picking a high threshold. I’m using a statistical approach called Otsu’s method which is effective on high contrast images. In this case, the puzzles are usually printed in black ink on white paper which is a perfect fit. I’m not going to go over how Otsu’s method works in interest of keeping this blog series from getting any longer. However, the output hovers around 110 for all of my test cameras and puzzles so that’s probably a good place to start experimenting.
Building on the output of the Canny edge detector, the next post will cover the detection of straight lines which might indicate the grid in a Sudoku puzzle.